Code for this post can be found here if you want to follow along. It includes the trace.json which you can directly throw into chrome://tracing and play with.
To optimize inference we must first understand where time is being spent and what the bottlenecks are. At the highest level Diffusion Policy involves through a forward pass through ResNet-50 to obtain image embeddings, some number of denoising iterations involving a U-Net, the Huggingface Diffusers library to obtain an action, and time spent in a CPU simulation of a toy task to obtain the next image observation. We can use some simple time.perf_counters() in Python to figure out the distribution of time between these three buckets. We use torch.cuda.synchronize() before every timing is measured to ensure all CUDA streams are cleared before measuring time taken for that piece of Python code. This is important because Pytorch runs asynchronously w.r.t GPU kernels. When using the Python time module without synchronizing CUDA streams, you may actually be prematurely ending the window for that timing as computations associated with that chunk of code are still in progress on the GPU. After this coarse-grained profiling we find this breakdown:
Time spent in vision encoder: 0.123s Time spent in U-Net: 8.362s Time spent in Diffusers: 0.617s Time spend outside of that: 0.424s Total time: 9.528s
From our rough first pass at profiling this network, we see that the U-Net and the diffusers library is responsible for the bulk (~94%) of total program runtime. The results above are with 100 denoising iterations per step, and 26 total steps. Given that we run 100 forward passes through the U-Net for every time the resnet or physics simulation is ran, this breakdown seems reasonable. In order to better understand how a U-Net forward pass is broken down, we can use the Pytorch profiler and HTA (Meta’s open source holistic trace analysis tool).
Horace He's blog post does a much better job of explaining this than I do. You should give it a read here!
Deep learning models in Pytorch eager mode can spend time during a forward pass in two buckets:
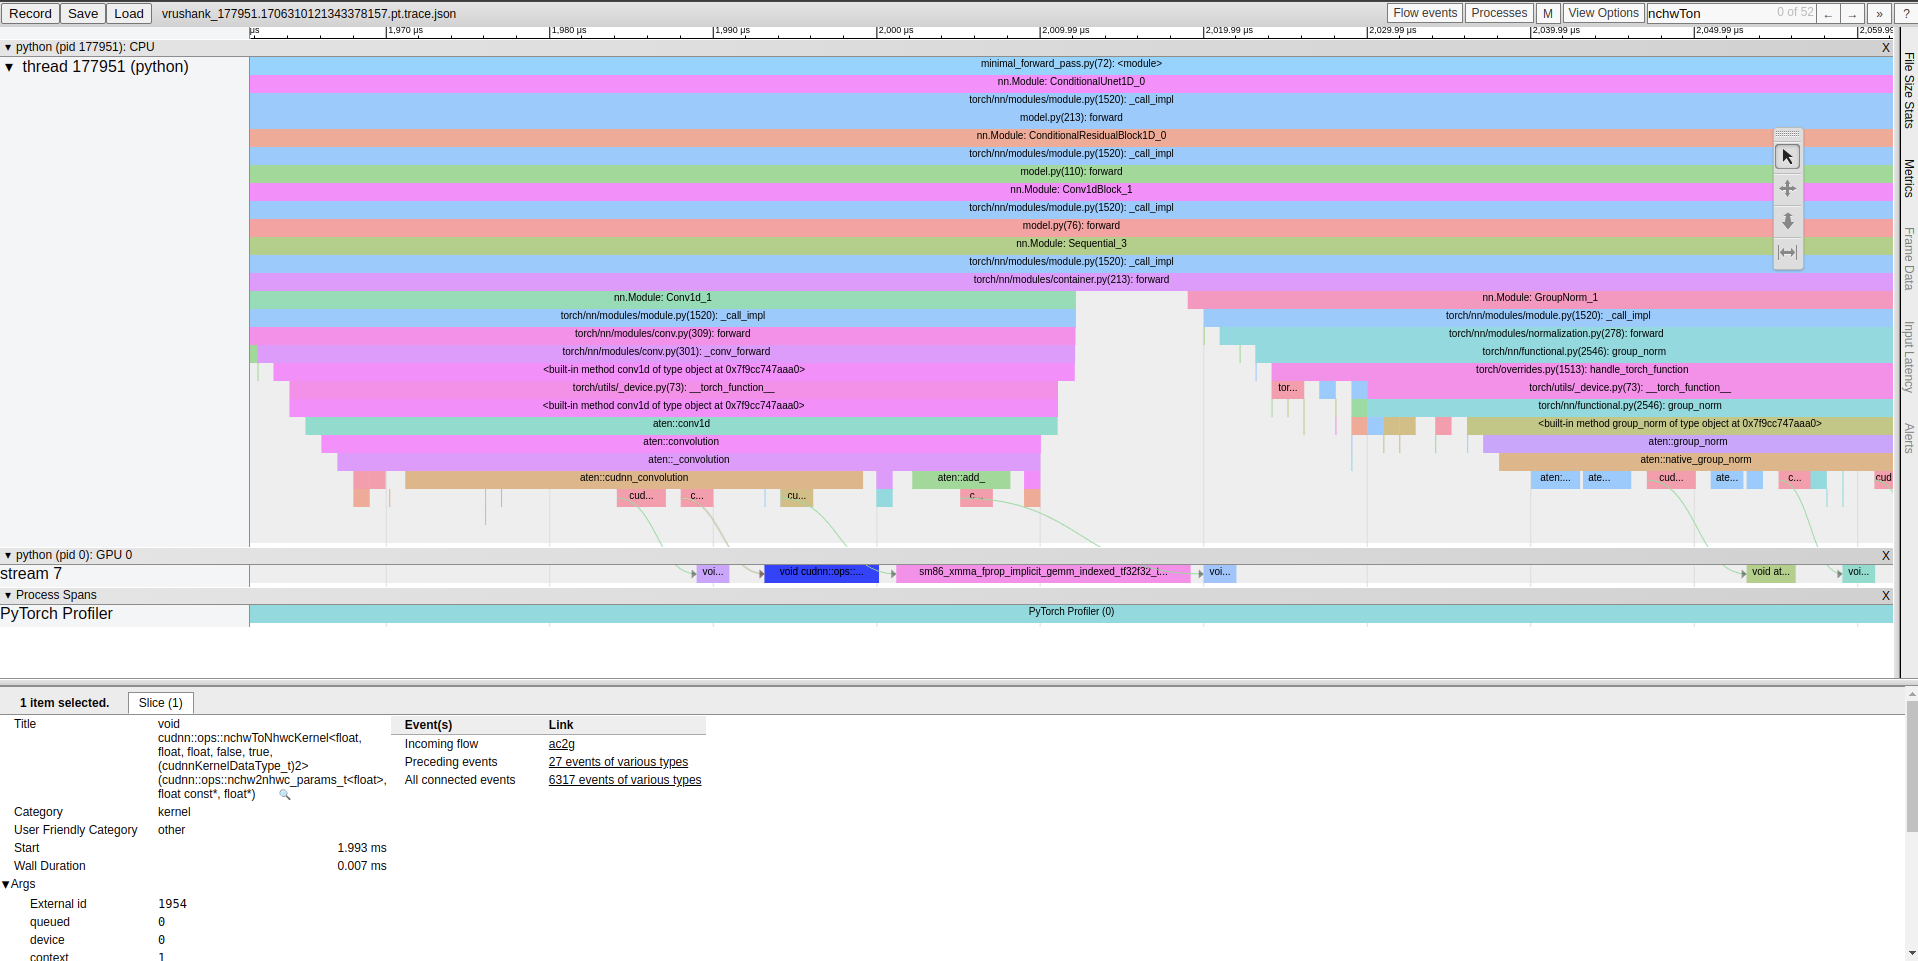
As mentioned earlier, Pytorch operates async w.r.t CUDA and kernel dispatch can overlap with kernel execution on the GPU. For now, we mostly care about understanding how much time is being spent in each bucket and which kernels are most responsible for time spent in CUDA land. Through profilinga single forward pass through the U-Net/Diffusers library we find several interesting things.
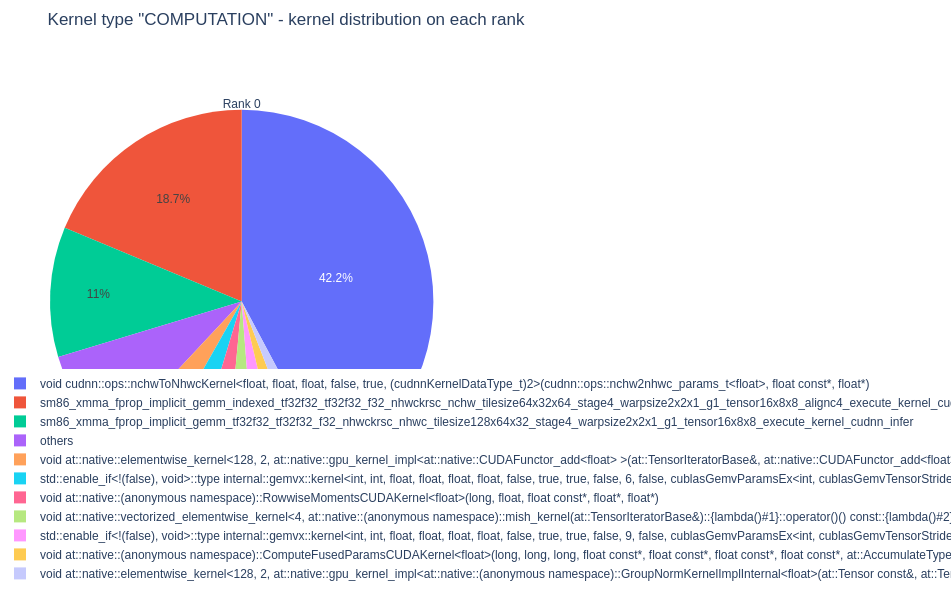
These kernels are responsible for transforming a tensor from [N, C, H, W] to [N, H, W, C] and performing implicit GEMMs. Using Chrome’s tracing tool (chrome://tracing) we cansearch for these kernels in our trace and use the event flow to trace them back to the layers/operations that created them.